In my last Dystopian Wars article, I developed a conversion factor to turn game movement ratings into speeds (as it turns out, I reckoned it is rougly 2.67 knots per inch of movement). I speculated at the time that this also had some interesting implications for the table scale of Dystopian Wars, and that is what I’m going to tackle this time around!
Map Scale Vs. Model Scale
Rarely do miniature games, regardless if they are land, sea, air, or even space games, portray things as exactly “in scale.” That is, typically the models are not what they seem. Sometimes, a single model might represent a group of such models. For example, a single tank might represent a tank squadron, platoon, or an even larger formation. More commonly though, games use a different scale for the table than they do for the models. This allows for a standard 6×4′ gaming table to represent a range of different sized areas depending on the needs and desires of the game designer (within reason, of course!). In Dystopian Wars, the models are said to be 1/1200 scale, which means that one inch on the model equals 1200 inches, or 100 feet, in “real life.” However, that does not necessarily mean that one inch of space on the table is equal to 100 feet; that would tend to make shooting ranges oddly short, for example. As with the speeds, DW does not explicitly state a map scale, due to what I suspect is a “top-down” game design philosophy. That is not inherently a bad thing, but it does mean that we will have to use some creativity to come up with a back-fit solution. In this, I’ve come up with two approaches. One is the Speed approach, and the other is the Gunnery Range approach.
Approach 1: Speed
Given that I’ve already come up with a speed conversion, it is fairly easy to solve for distance traveled, as long as we assume a time. The amount of time each turn in DW represents, like the model speeds and the table scale, are not explicitly defined. So, what I have done is to take my conversion factor and make a simple comparison table, seeing how far 1″ would represent for a range of turn times, from 1 minute all the way up to 15 (by way of comparison, 3 minute and 6 minute turns are often used in historical naval games). Here is the result (the left column is in minutes per turn):
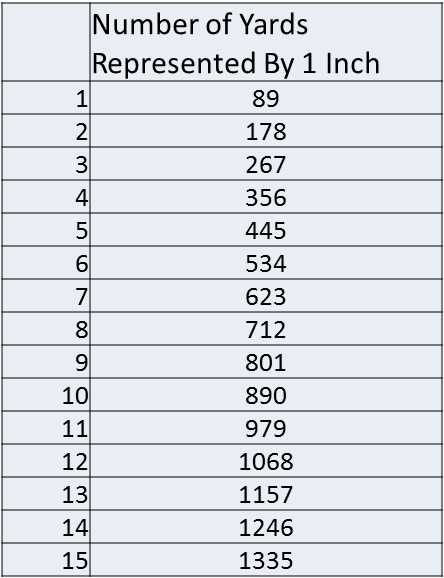 A couple of important take-aways here. First of all, we can see that even with a fairly short turn time of 1 minute, the map scale is still much larger than the model scale (1 inch equals 33.3 yards in 1/1200 scale). Second, note that at 3 minutes, the number of yards representing one inch is equal to my speed conversion (2.67) multiplied by 100. This is what mariners refer to as the “3 Minute Rule,” which states that speed (in knots) times 100 equals the distance traveled in yards every 3 minutes.
At first glance, I kind of like the 6 minute turn; 500 yards per inch is an easy thumb rule to remember, plus it seems like a decent scale reduction. Let’s see how it stacks up compared to the Gunnery Range approach, though!
Approach 2: Gunnery Range
This technique is more akin to the one I used to estimate speeds during my previous article; it involves looking at historical precedent and then relating that to the stats for DW to come up with a reasonable conversion. This time, instead of speed we will be looking at gunnery ranges. In DW, the max weapons range is 32.” So, the natural thing to do would be to compare that to the historical maximum weapons range from history, divide by 32,” and presto! That’s that! Or is it?
The problem we have is that there isn’t one fixed “max weapons range” when it comes to historical naval combat. Keep in mind, I’m only talking about max effective range; many naval guns could shoot further than they could be effectively aimed. Ever since someone first figured out they could strap a canon onto the deck of a sailing ship in the 1300’s, until the end of the gun’s reign as the primary naval weapon system in the 1940s, the general trend is that range grew over time. The upward trend in range could see dramatic spikes during wartime; for example, during the Russo-Japanese War of 1904-1905, effective gunnery ranges were around 6,000 yards. Just over 10 years later, after a period of rapid technological development, the German and British battle lines engaged each other at Jutland at ranges out to 14,000 yards. Almost 30 years after that, and the US battleships at the Battle of Surigao Straight were able to hammer the Japanese battle line at ranges in excess of 20,000 yards on a moonless night, with the aid of their radar fire control.
So, what range to we want to pick for our conversion? With the speed conversion, I chose the speeds of WWII combatants. As I stated at the time, I feel that the technology level exhibited in DW most approximates what we saw in our world during WWII, minus the steel-tentacled, steam-powered squid submarines. Taking the WWII engagement range to establish a table scale may not be compatible with my earlier speed-based approach, however. Let’s take a look, with the aid of another handy-dandy chart (gunnery ranges are in yards):
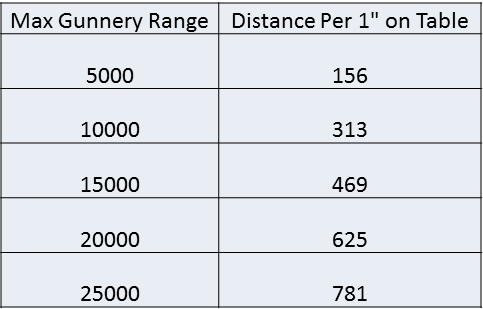
So, here we see some interesting convergence. If we assume that 32″ represents a maximum effective gunnery range of just over 15,000 yards (16,000 yards to be exact), then the distances start to nicely match up with our previous approach of calculating distances using speeds. This is somewhat shorter than the maximum ranges that were achieved in WWII, but I think they are still reasonable given that models in DW lack any visible evidence of radars, direction finders, and other important doo-dads that are essential to achieving those sorts of ranges. In short, this approach reinforces my earlier assumption about 6 minute turns and 500 yards per inch for the table scale.
A Second Opinion
Back when I posted my first article over on the Spartan Games forums, community member James, who goes by the handle of Bunnahabhain, had this to say about table scales:
You can also find a map scale fairly easily.
Assuming WW1 level gunnery, you get 1″ on board approximately equals 600( sorry, typo!) meters/yards, i.e. a map scale of 1:24,000 or 1:25,000.
Conveniently, this either gives us an easy model: map scale of 1:20, or the common map scale of 1:25000, so allowing you to fight over real maps if you want!
This also means you can get a length of turn, which comes out at about 6 minutes.
I’m not saying these numbers are right, but they are certainly sensible, credible, and round enough to be easy to remember.
-James
James here used the same method as my second approach, and came up with a very similar answer. I personally happen to like 1 inch equals 500 yards myself, which is a scale of 1:18000, but as we have seen that is based solely on the assumptions I made, and making different assumptions can yield widely different results!
Conclusion
After all of that, I think that it is reasonable to conclude that a 6 minute time scale, with a map scale of 1:18,000 (rendering 1 inch being equal to 500 yards) work as back-fit solutions for DW. As James points out though, these figures are based on assumptions that are very much open to interpretation. So, if you prefer longer or shorter time scales, or larger map scales, have at it!
Until next time…
Well thought out and written.